ECOO '13 R2 P2 - The Walking Dead
View as PDFThe zombie apocalypse has finally arrived. You were at school when it happened and now you are trapped in a portable classroom on the edge of a schoolyard that is swarming with the re-animated corpses of your former teachers and classmates. Fortunately, you saw this coming weeks ago and cunningly buried explosive devices in key locations. One of them is under the schoolyard. You can start the bomb's countdown timer from your smartphone. Right now the zombies are just milling around aimlessly. When the bomb detonates it will destroy some of them and the rest will start moving towards the sound, giving you the space you need to make it across the field.
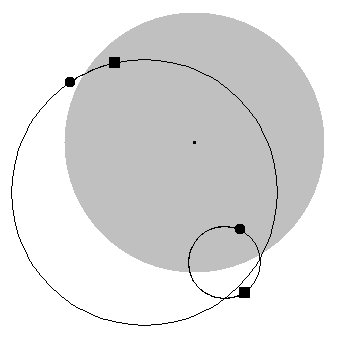
Zombies always walk with a limp, so when they have nowhere in particular to go they end up walking in circles. When you trigger your explosive device, the zombies will continue to walk during the countdown and then when the bomb goes off, any zombie inside the circular blast area will be destroyed.
In the picture at right, the grey circle shows the area covered by the bomb blast and the outlined circles show the paths of two zombies. One is moving quickly (for a zombie) in a clockwise direction and is limping quite badly so it walks in a tight circle. The other is limping less and moving more slowly in a counter-clockwise direction. The black squares show their positions when the timer was started and the black circles show where they were when the bomb went off. As you can see one zombie was destroyed in the blast and the other escaped.
The input contains different cases.
Each case starts with a line containing four numbers , and
separated by spaces. The location of the bomb (in metres relative to the centre of the schoolyard) is given by the floating point numbers
and
(
– it's a big school, ok?). The blast radius of the bomb (in metres) is given by the floating point number
.
is an integer representing the number of seconds until the bomb goes off.
This is followed by an integer on its own line representing the number of zombies on the field
.
This is followed by lines, each representing a zombie using
floating point numbers separated by spaces:
,
,
,
, and
. The position of the zombie is given by
and
and the centre point of the zombie's circular path is given by
and
.
is the speed of the zombie in metres per second
where a positive speed indicates clockwise motion and a negative speed indicates counter-clockwise motion. All floating point numbers in the file have at most two digits after the decimal point.
Your job is to output an integer representing the number of zombies that will be destroyed by the bomb when it goes off. When determining whether a zombie is within the bomb blast area, you should round its position to two decimal places and consider the zombie destroyed if it is within the bomb blast or if it is exactly on the border. Don't worry about zombies bumping into each other as they walk, just assume that won't happen.
Note that the sample data below consists of only cases with boldfacing used to separate them visually. The real data files have
cases each.
Sample Input
0.0 0.0 130.0 500
2
50.0 -150.0 30.0 -120.0 0.3
-80.0 80.0 -50.0 -50.0 -0.1
-17.11 16.81 21.99 79
4
-7.91 22.79 -18.07 13.85 -0.13
-19.53 -19.43 -19.37 13.35 -0.21
10.65 -1.34 0.23 -16.52 0.2
-3.25 -24.61 16.21 18.87 0.17
1.48 21.27 20.24 13
12
-3.6 -20.42 23.02 -15.12 -0.16
19.95 -14.18 -6.0 -23.23 -0.18
5.15 13.06 20.26 11.81 0.26
4.16 -18.42 -13.43 16.23 -0.07
-24.79 12.28 4.11 9.55 -0.13
12.31 11.1 11.87 20.86 0.05
11.78 12.93 -7.82 -24.35 0.03
-14.71 -15.49 16.43 -3.9 0.15
14.31 5.03 -22.68 16.29 -0.05
-22.1 4.86 13.96 -7.16 -0.2
-21.16 -11.18 4.71 -7.64 -0.04
12.74 14.08 -1.88 -5.92 0.16
-13.83 4.62 21.45 61
16
-7.66 -3.24 1.33 -6.53 0.03
-19.0 -0.56 -13.26 24.93 0.03
-7.5 -20.3 -23.88 -5.15 -0.01
-12.09 -4.41 14.17 -0.82 0.08
-11.48 18.29 -1.8 7.82 0.15
20.57 13.01 -17.16 -3.08 -0.15
8.39 0.29 -8.25 -23.22 0.04
6.07 -16.38 -0.48 22.44 0.11
16.92 20.4 0.64 -16.19 0.02
-14.67 -1.2 -18.32 3.41 0.25
16.27 1.26 -2.92 18.78 -0.12
-9.25 1.74 -8.01 2.07 -0.07
10.88 17.68 6.2 3.94 0.23
21.08 -9.37 10.94 1.29 0.09
11.31 8.68 -17.95 9.54 -0.1
-1.46 21.11 13.39 9.04 -0.12
4.57 8.57 18.83 169
20
22.2 5.22 18.09 18.98 0.04
-24.75 -14.48 -24.14 -16.0 0.01
-5.22 -16.06 5.75 -3.2 -0.05
9.5 22.34 12.87 -24.34 0.06
-22.32 19.67 16.79 8.64 -0.02
4.46 10.22 14.43 22.25 -0.21
-15.7 -18.05 1.37 -5.16 0.19
-8.34 -6.63 -16.61 16.73 -0.07
22.78 -17.16 19.91 12.26 0.23
-14.35 18.54 1.5 -11.14 0.14
-5.22 9.95 21.32 5.24 0.08
1.61 9.98 -22.21 -2.42 0.22
-12.72 15.29 -3.63 -19.68 0.05
-3.74 9.51 -7.84 -3.44 -0.08
-20.14 -17.28 -0.82 2.43 -0.24
-11.01 -12.15 -0.81 11.95 -0.17
10.91 1.02 -13.54 18.59 -0.02
-6.2 7.71 18.18 -20.29 -0.08
-22.82 -24.88 23.3 -7.44 -0.13
20.95 -16.7 7.61 -23.1 -0.06
Sample Output
1
1
4
7
8
Educational Computing Organization of Ontario - statements, test data and other materials can be found at ecoocs.org
Comments